A data-driven approach to farm resource management. This project is an applied research project during my master’s programme at the University of Amsterdam.
Context
The landscape of farming in the Netherlands is evolving rapidly in response to the challenges posed by climate change. As temperatures and rainfall patterns shift, farmers are grappling with a changing environment that directly impacts their crops. These changes not only affect primary factors like temperature and rainfall but also lead to secondary effects such as shifts in insect populations and fungal growth.
One crucial aspect influencing farming in the Netherlands is water management. Historically, the country has been known for its abundance of water, but climate change has brought about extreme weather events, including flash floods and droughts. Farmers, whose water needs vary depending on their specific crops and methods of cultivation, are now facing shortages and rationing, prompting some to petition regional governments for increased water access during dry spells.
However, addressing climate change goes beyond adapting to new weather patterns; it also requires updating existing policies that may no longer be suitable. Current laws, such as EU directive 2018/841, may inadvertently hinder adaptation efforts by preventing farmers from storing water on their fields for future use during droughts.
The Netherlands also faces challenges related to nitrogen emissions, impacting not only the environment but also the economy. Measures to control emissions have faced setbacks, leading to legal battles and economic repercussions. As the country grapples with these issues, it becomes clear that proactive measures to manage water usage on farms are essential to mitigate the commercial impact on farmers.
Efficient water management is crucial for maximizing crop yields, especially as environmental conditions continue to change. In some regions, such as Zeeland, soil salinity poses challenges to traditional crops like potatoes, necessitating innovative solutions like leeching and salt-tolerant crops. By providing farmers with insights into moisture levels and vegetation health, companies like Agurotech (project partner) aim to empower informed decision-making and optimize water usage for increased crop yields.
The Project
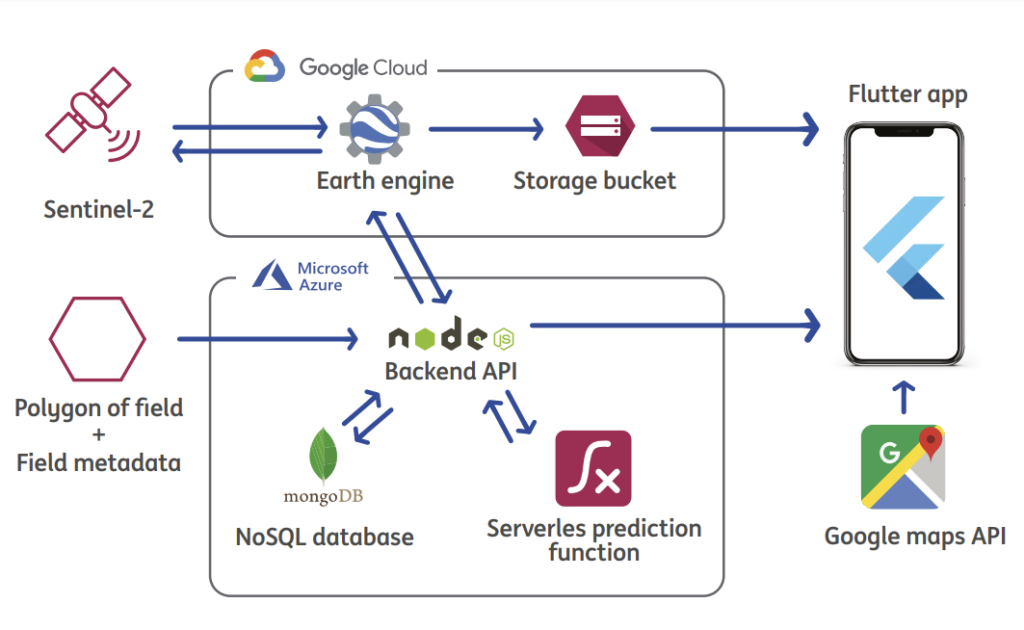
Let’s explore the implementation details of our final architecture design as depicted in Figure 3. Our system begins with the initial input of a field polygon, along with its corresponding name and planted crop. This data is then transmitted to a node.js backend, which subsequently forwards the polygon information to an Earth Engine script responsible for computing the necessary indices for the last planting season.
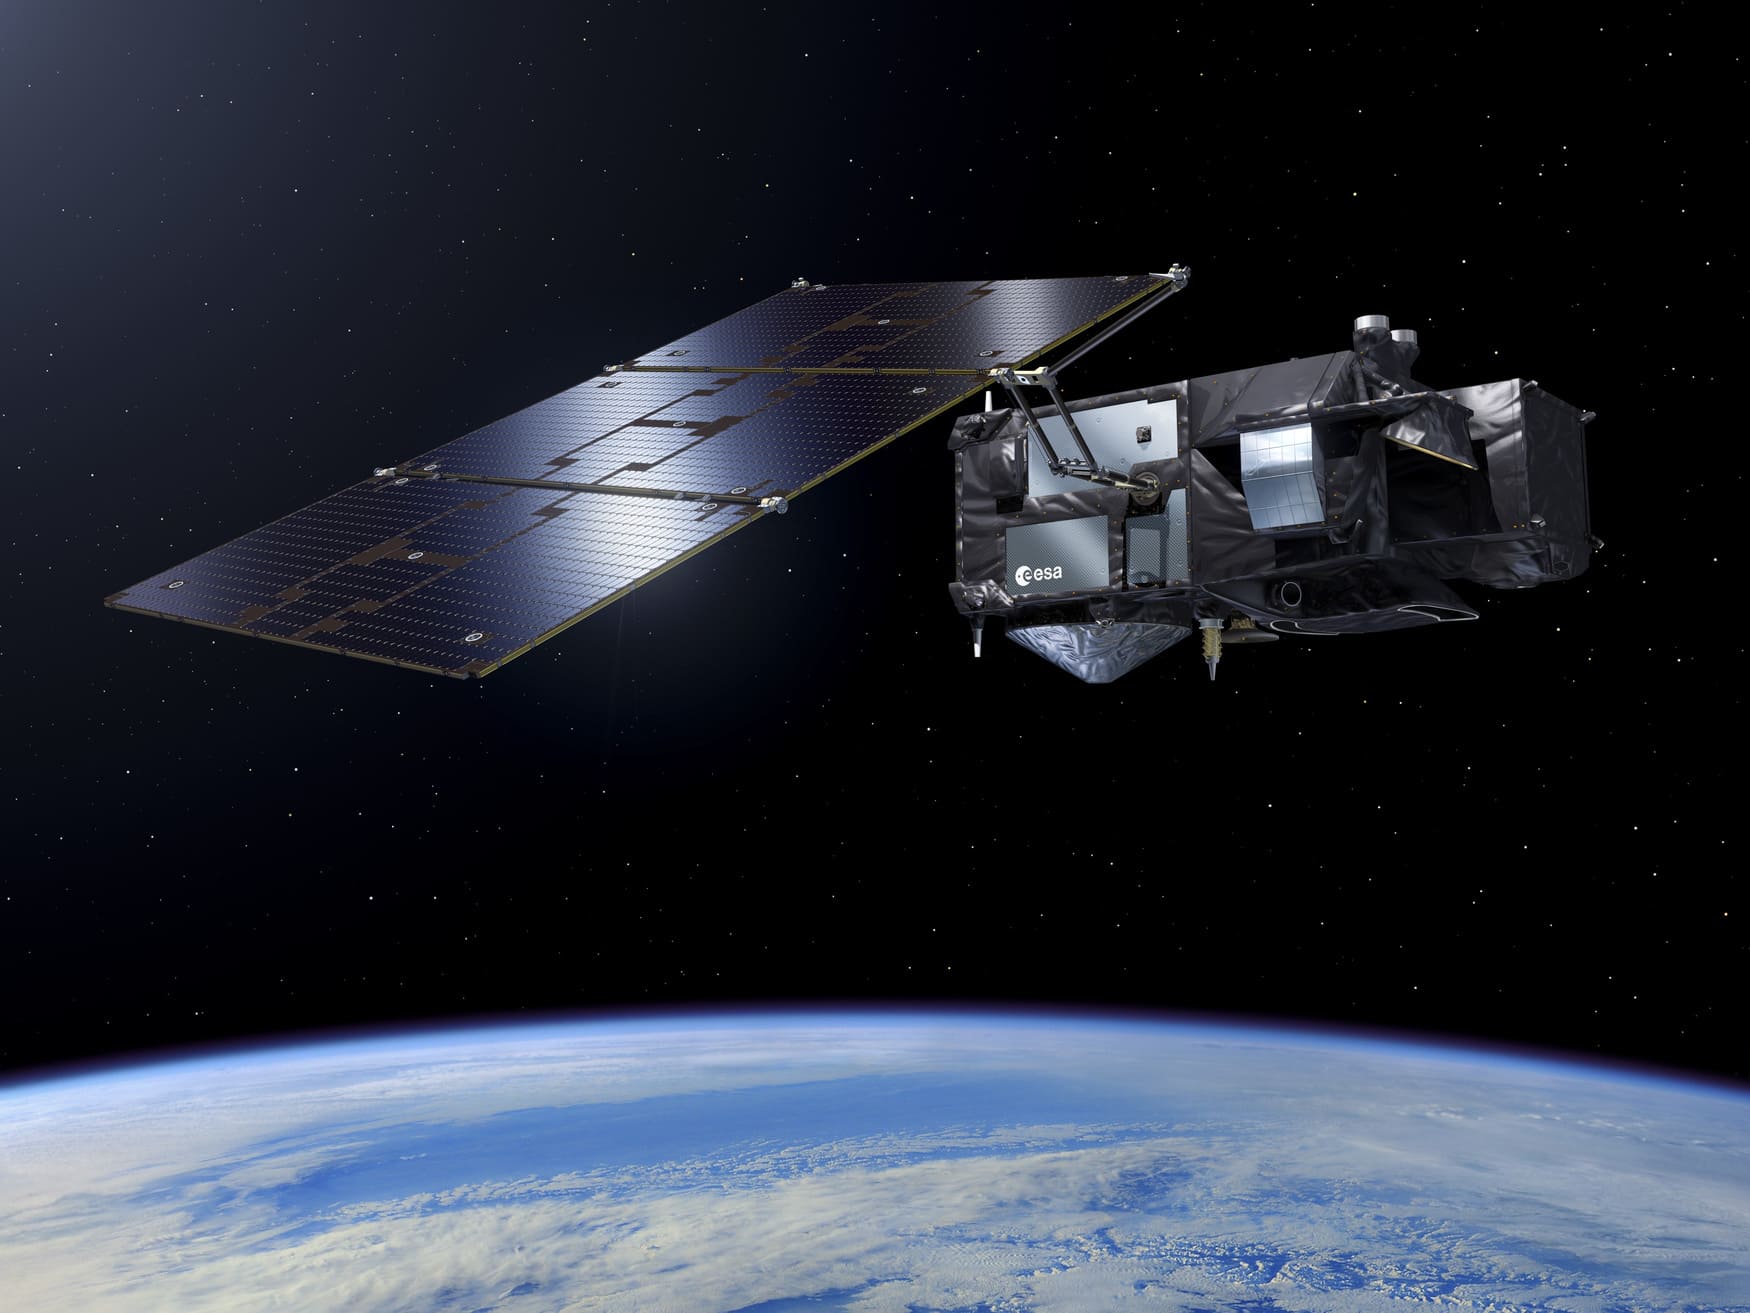
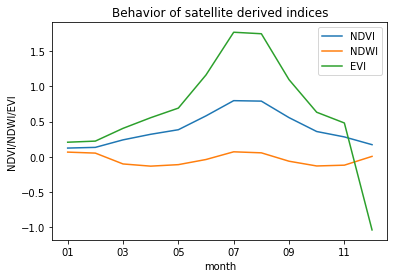
The Earth Engine script starts by querying all images captured by the Sentinel-2 constellation over the selected polygon during the previous season. Only images with less than 30% cloud cover are retained for further processing. Cloudy pixels are then removed from these selected images to enhance accuracy, following which the NDWI, NDVI, and EVI indices are calculated for each field pixel. These calculations involve comparing the visual channels of the satellite image with its near-infrared-based channel. The average index values over time are then sent back to the backend service and stored in the connected MongoDB database.
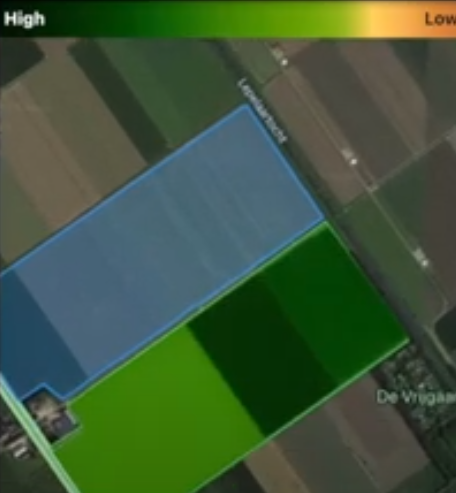
Subsequently, the backend service triggers an Earth Engine overlay generation script, which selects the latest cloud-free image and generates two different views of the Sentinel picture using various color schemes for NDVI and NDWI. These views are exported to a Google Cloud Storage bucket in a Google Maps tile map format.
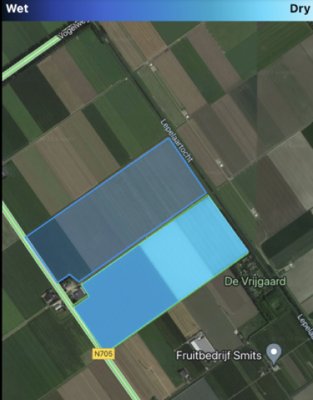
Meanwhile, the NDWI, NDVI, EVI, and crop type data are passed to a serverless prediction function. The model s incorporated by importing the weight file generated after training the model. The predicted values are returned to the backend and stored in the MongoDB storage. When the Flutter app requests data from the exposed API of the node.js backend service, it receives all indices and forecasted yield information along with the field’s polygon. These insights from the indices and predictions are utilized to render graphs within the app. Additionally, if the user selects a field, the app loads the overlay from the Google Cloud Storage bucket using the Tilemap API of the Google Maps service, which renders the base map on the app’s main screen.
The architecture, with the backend, storage, and serverless prediction function hosted on Microsoft Azure due to financial constraints during the academic MVP creation phase. However, similar services can be provided on the Google Cloud Platform to facilitate integration into Agurotech’s architecture.
The data
In addition to the technical implementation, the project involved comprehensive data analysis and processing. We utilized the “ML4EARTH HACKATHON DATASET” from the University of Munich, containing information about 473 counties in the top 5 growing corn states in the USA from 2003 to 2021. This dataset, consisting of crop yield, imagery, and county information, underwent exploratory data analysis (EDA) to identify trends and correlations. Subsequently, data processing involved importing datasets, scaling features, and merging relevant columns to prepare the data for modeling.
Feature Explanation
MODIS surface reflectance (band 1 – 7) Surface reflectance bands of the satellite imagery
Tmin Gridded estimate of minimum temperature of the day
Tmax Gridded estimate of maximum temperature of the day
Prcp Gridded estimate of precipitation of the day
Heat/coldwave index Index computed from daymet temperature data
Drought index Drought in the US based on five classifications, D0 – D4
NDVI Normalised difference vegetation index
EVI Enhanced vegetation index
NDWI Normalised difference water index
Throughout the project, team management was crucial, with tasks divided equally among members. Each member contributed to the development of the prototype, ensuring a collaborative effort towards delivering a functional end product.
In our quest to predict crop yield using satellite imagery-derived indices, we experimented with various machine learning models, ranging from simple linear regression to complex neural networks. Here’s a summary of our findings:
- Linear Regression: This basic method estimated a line between data points to minimize absolute residuals. However, it yielded an RMSE of 0.181, indicating modest performance.
- Polynomial Regression: Adding polynomial features slightly improved the model, but not significantly, with an RMSE of 0.176.
- Gradient Boosting Regressor: This ensemble method showed promise, especially after hyperparameter tuning, with an RMSE of 0.160, making it the best-performing model at that point.
- Random Forest Regressor: Using multiple decision trees, this method excelled, especially after tuning parameters, achieving the lowest RMSE of 0.054 among all tested models.
- XGBoost Regressor: While performing decently, it couldn’t surpass the Random Forest Regressor in terms of RMSE, with a score of 0.148.
- MLP Regressor (Neural Network): Due to computational challenges, we stuck with default parameters. While the RMSE was acceptable at 0.210, there’s potential for improvement with more computational power.
Across all models, the “Year” variable emerged as the most influential predictor, while NDVI, EVI, NDWI, and Days to Harvest (scaled) contributed nearly equally to the models’ predictive power.
Our exploration underscores the importance of selecting appropriate models and fine-tuning parameters to achieve accurate crop yield predictions. With further refinement and computational resources, we can enhance predictive capabilities and better support agricultural decision-making.
See the source code
https://github.com/NadaAlberts/Data-Systems-Project/tree/main